Implementing naming conventions using labels in checkmk

Most IT organizations have strict naming conventions for their hosts (servers, network devices and others) representing valuable information about:

  • country
  • region
  • customer
  • application
  • server
  • client
  • network
  • environment (test/production)

This list might be longer or any kind of subset of these attributes. As a sample I use my devices available in my home environment. (A review of my naming convention seems to be very urgent…)

Often naming conventions offer the ability to understand the usage of a given device, the location, or whatever. This information is also required to make your monitoring journey a success.

checkmk offers two key features to attach information of this kind to discovered hosts, labels and tags. In my opinion, the most valuable advantage of labels, compared to tags, is the ability to assign labels dynamically, without any dependency to folders or other mechanism.

This qualifies labels to dynamically apply “attributes” to hosts, using the currently valid naming conventions.

My home naming conventions are:
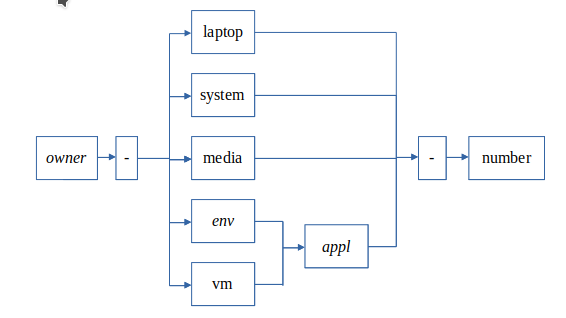
The following things I’d like to identify for monitoring:

  • the owner of the system
  • the type of the system (virtual system or physical)
  • the application, which is hosted on the system
  • the classification of the physical systems (e.g.: always online or not)

To do so, follow these steps in checkmk:

First Step: Open the setup dialog
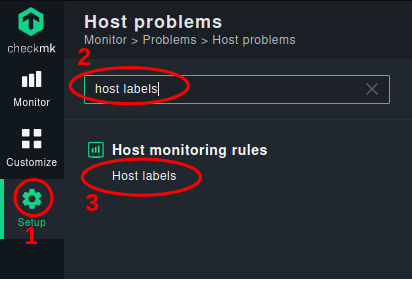
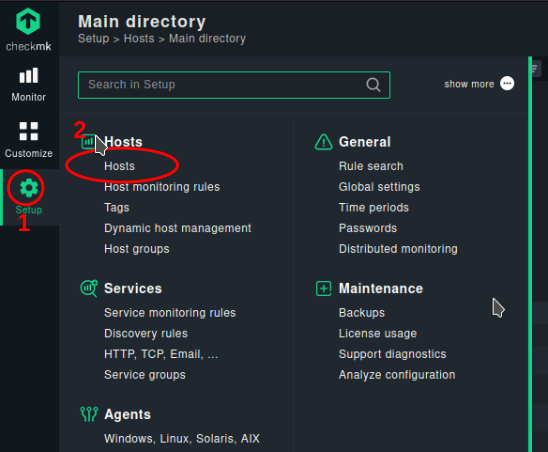
  1. Type “host labels” in the search area
  2. In the navigation bar click “Setup”
  3. Click on host labels to enter the rules area for labels

Second Step: Use the “Create rule in folder” button
As naming conventions should apply across all systems in my monitoring environment, I create these rules in the “Main directory”.


Fill in your settings
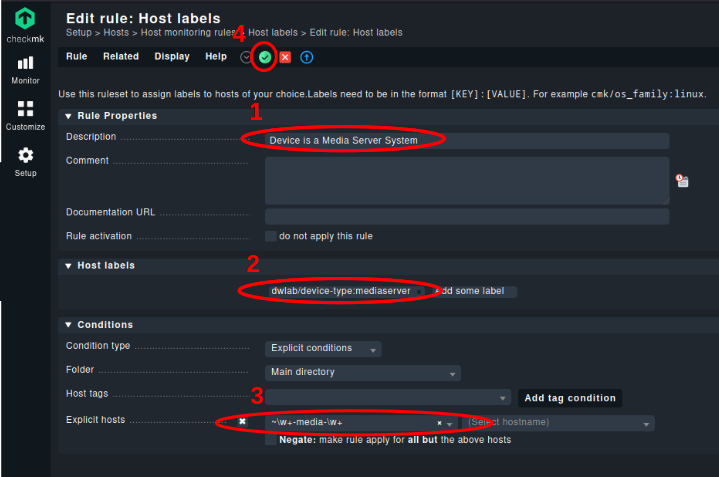
  1. A description of your Rule
  2. The label you want to attach to this set of devices (how labels work)
  3. Select explicit hosts, to write down a regular expression, selecting the focused host names. The “~” indicates, that a regular expression will follow.
  4. Don’t forget to save your changes.

After repeating the above steps for all of my weak naming convention entries, I have the following rule set.
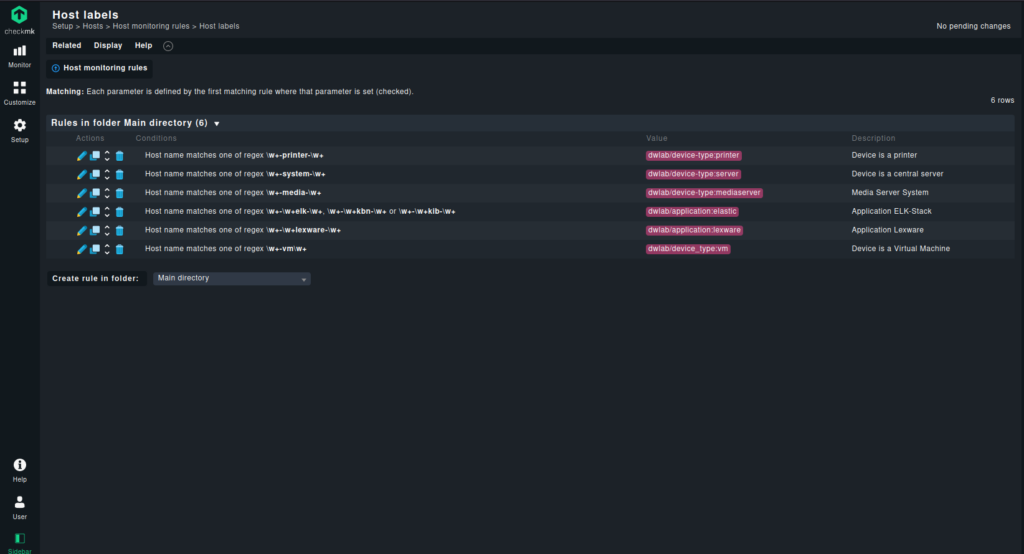
Please note, that my label names follow some conventions, to make sure, that there is no chaos introduced in the setup of checkmk.

Summary:

Labels can be implied dynamically to the hosts in your checkmk monitoring environment. Tags can’t be applied in this way. Labels can be used later on, while defining monitoring rules, views, dashboard, filters and so on. Labels are a good mechanism to group hosts in different dimensions.

Discover new devices in a Network with checkmk

After having installed checkmk it is one of the first tasks to discover all devices in a given network.

To do so please follow the steps below:

Enter Setup Hosts

Create a stage folder to place newly discovered hosts in.

Click Add Folder
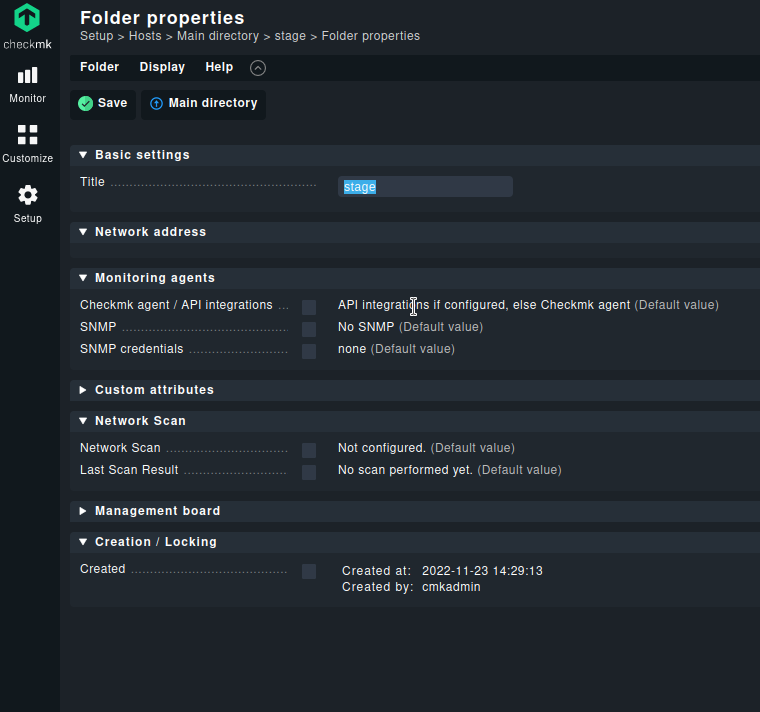
Type in the Title within the basic settings and press the save button

To handle several networks, several sub-folders will be created (this is optional).

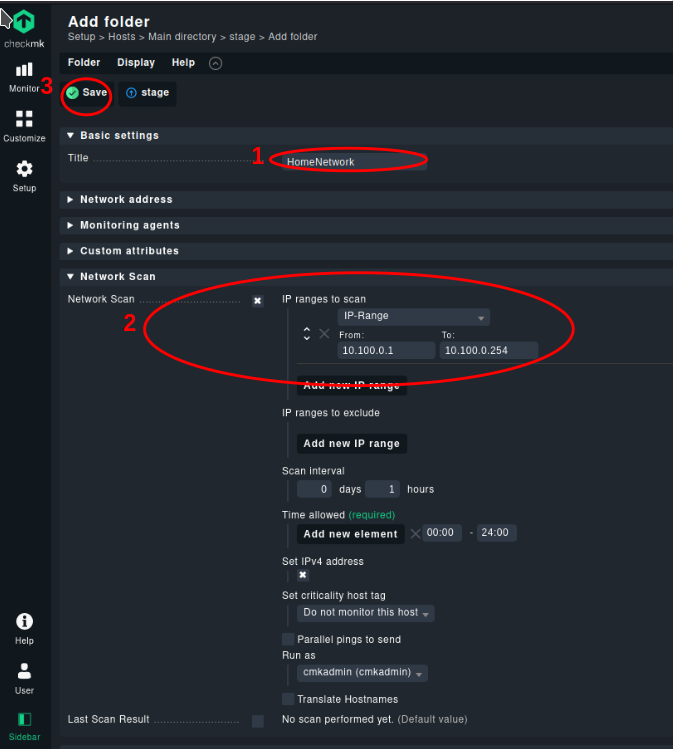
Enter stage folder and click Add folder again

Type in your specific settings and don’t forget to press the Save button
  • Select Network Scan
  • Add new IP range
  • Select Set IPv4 address
  • Set criticality host tag to “Do not monitor this host”

The Scan Interval is important, if you want detect new device quickly.

There are a lot of other settings possible. Please consult the documentation for further details (Section 6 of the linked article).

IT Service Management – Traveling To The Cloud

More and more customers are moving to cloud architectures to fulfill the alternating resource requirements in the IT. Traditional monitoring approaches with checking the availability of a single system or resource instance does only make limited sense in this new era. Resources are provisioned and removed on dynamic request and have no long term life date.

It no longer matters whether a named system exists or not, it is about the service, and its implementing pieces. The number of systems will vary in accordance to the workload covered by the service. In some cases the service itself may disappear, when it is not permanently required. The key metric is the response time the service consumers achieve. But how can we assure this key performance metric at the highest level, without being hit by an unpredicted slowdown or outage.

We need a common monitoring tool watching the key performance metric keys on a resource level and frequently check the availability of these resources, like:

  • Disk

  • Memory

  • Network

  • CPU

Application containers will also be handled like resources, e.g.:

  • Java Heap

  • Servlet Container

  • Bean Container

  • Messaging Bus

Also resources from database systems, messaging engines and so on are monitored. With IBM Monitoring we have a useful and easy to handle tool, available on-premise and in the cloud.

With this data achieved by the monitoring tool, we can now feed a predictive insight tool. As described in a previous post, monitoring is the enabler for prediction. Prediction is a key success factor in cloud environments. It is essential to understand the behavior of an application in such an environment in a long term.

The promise of the cloud is, that an application has almost unlimited resources. If we are getting short on resources, we simply add additional ones. But how could be detect, that the application is behaving somehow suspicious? Every time we are adding additional resources these are eaten up by the workload. Does this correlate to the number of transaction, to the number of users or other metrics? Or is it a misbehaving application?

We need a correlation between different metrics. But are we able to oversee all possible dependencies? Are we aware of all these correlations?

IBM Operations Analytics Predictive Insights will help you in this area. Based on statistical models, it discovers mathematical relationships between metrics. A human intervention is not needed to achieve this result. The only thing to happen is, that the metrics are provided as streams in a frequent interval.

After the learning process is finished, the tool will send events on unexpected behavior, covering uni-variate and multivariate threshold violations.

For example, you have three metrics:

  • Number of request

  • Response time

  • Number of OS images handling the workload

Raising number of OS Images wouldn’t be detected by a simple threshold on a single resource, covered by the traditional monitoring solution.

Either the response time shows no anomaly nor the number of users does. Also the correlation between these to data streams remains inconspicuous. However, adding the number of OS images shows an anomaly in the relation to the other values. This could lead to a situation, where all available (even the cloud resources are limited, because we can’t afford it) resources are eaten up. In this situation our resource monitor would send out an alarm at a much later point of time.

For example, first, the OS agent would report a high CPU usage. Second, the response time delivered to the end users would reach a predefined limit. The time between the first resource event and the point in time where the user’s service level agreement metric (response time) is violated is too short to react.

With IBM Operations Analytics Predictive Insights we earn time to react.

So what is your impression? Did you also identify correlations to watch out for after analyzing the reason for a major outage and the way to avoid this outage?

Follow me on Twitter @DetlefWolf, or drop me a discussion point below to continue the conversation.

In my next blog I will start a discussion which values make sense to be fed into a prediction tool.

SCAPI: Preparing your system — Software Packages

Before you can install SmartCloud Analytics Insight (SCAPI) you have to meet the software prerequisites on the RedHat Enterprise Linux Server system you are using to host the SCAPI Data Server Components. Currently only RHEL 6 64-bit is supported.

The documentation names the requirements in several locations of the installation brochure.

I’m using the following command stack to make sure that all software packages are installed:

  • yum -y install libstdc++.i686
  • yum -y install *libstdc++-33*.i*86
  • yum -y install openmotif22*.*86
  • yum -y install pam.i686
  • yum -y install libXpm.i686
  • yum -y install libXtst.i686
  • yum -y install freetype.i686
  • yum -y install libmcpp.i686
  • yum -y install libXdmcp.i686
  • yum -y install libxkbfile.i686
  • yum -y install libpciaccess.i686
  • yum -y install libXxf86misc
  • yum -y install libXm.so.4
  • yum -y install ksh*
  • yum -y install libstdc++.*
  • yum -y install *libstdc++-33*
  • yum -y install openmotif22*
  • yum -y install compat-glibc
  • yum -y install pam
  • yum -y install libXpm
  • yum -y install libXtst
  • yum -y install freetype
  • yum -y install xorg-x11-xinit
  • yum -y install Xorg
  • yum -y install firefox
  • yum -y install openmotif
  • yum -y install atlas
  • yum -y install compat-libgfortran-41
  • yum -y install blas
  • yum -y install lapack
  • yum -y install dapl
  • yum -y install sg3_utils
  • yum -y install libstdc++.so.6
  • yum -y install libstdc++.so.5
  • yum -y install java-1.7*-openjdk.x86_64
    Java is required to get the prerequisite checker executed delivered with the IBM InfoSphere Streams software.
    The packages below are installed because the InfoSphere Streams checker.
  • yum -y install libcurl-devel.i686
  • yum -y install libcurl-devel.x86_64
  • yum -y install fuse-curlftpfs.x86_64
  • yum -y install libcurl.i686
  • yum -y install libcurl.x86_64
  • yum -y install perl-Time-HiRes
  • yum -y install perl-XML-Simple*
  • yum -y install gcc-c++

This command stack includes only those packages, which are provided by RedHat Satellite server.

After you installed all the packages above you have to add the provided RPM package as documented in the installation manual.

I’ve used the following command:

#
# Install provided InfoSphere RPM Prerequisite
rpm -Uvh <streams_unpack_folder>/rpm/*.rpm

Having all this packages installed, allows you to install all SCAPI software components.

Implementing the OMNIbus WebGUI in silent mode

After installing the OMNIbus WebGUI you have to implement the properties to direct the WebGUI server to the correct OMNIbus server and the correct authorization source.

To run the configuration wizard in silent mode, which is essential for repeated installations, use the ws_ant.sh shell script as documented in the manual.

The documentation suggests that you can locate the OMNIbusWebGUI.properties file in any location. This is not really true.

Inside this file other files are referenced which are provided in the same directory as the properties file.

The following approach worked for me:

I’ve installed the OMNIbus WebGUI server with default values, so it ended up in /opt/IBM/netcool/omnibus_webgui/ directory. In the subdirectory bin I’ve found the OMNIbusWebGUI.properties file.

Change the file accordingly to your installation and leave it in this directory.  As documented in the manual execute the ws_ant.sh script from this directory, adding the required activity.

The ws_ant.sh requires the build.xml in the working directory. build.xml file describes the different callable activities. These are

  • configureOS
  • resetVMM
  • configureVMM
  • restartServer

Through this build.xml file the WebSphere script execution is controlled.

In this xml file, the OMNIbusWebGUI.properties file is referenced with hard coded path names. Additionally, other XML files are referenced which are expected in the same directory.

So, edit the properties file in the location where you find it. And then execute the ws_ant shell script from this directory…